Wood strength depends on species, grain direction, moisture, defects, and how a member is graded and loaded. A species comparison helps explain material behavior, but clear-wood test results are not a load chart for a board or beam.
Read the property names first
The table reports modulus of rupture (MOR) from static bending and maximum crushing strength parallel to the grain. Values are in thousands of pounds per square inch. The source reports the second condition at 12% moisture content (MC), rather than using an unspecified generic ‘dry’ condition. Neither source column represents every product or jobsite moisture reading.
| Basswood, American | 5.0 | 8.7 | 2.22 | 4.73 |
|---|---|---|---|---|
| Cedar, N. white | 4.2 | 6.5 | 1.90 | 3.96 |
| Douglas Fir, coast | 7.7 | 12.4 | 3.78 | 7.23 |
| Douglas Fir, interior W. | 7.7 | 12.6 | 3.87 | 7.43 |
| Douglas Fir, interior N. | 7.4 | 13.1 | 3.47 | 6.90 |
| Fir, balsam | 5.5 | 9.2 | 2.63 | 5.28 |
6 rows
Scroll horizontally to view all columns.
The selected coast Douglas-fir row reports MOR values of 7.7 ksi green and 12.4 ksi dry. Its crushing values are 3.78 ksi and 7.23 ksi. These are reported test results, not allowable stresses. The source describes tests on clear, straight-grained specimens; this comparison does not include the knots and grade limits of ordinary framing lumber.
Green and dry results differ
Moisture affects many wood properties, and the response varies by species and property. Compare values within the labeled columns. Do not use the green-to-dry difference as a universal adjustment factor.
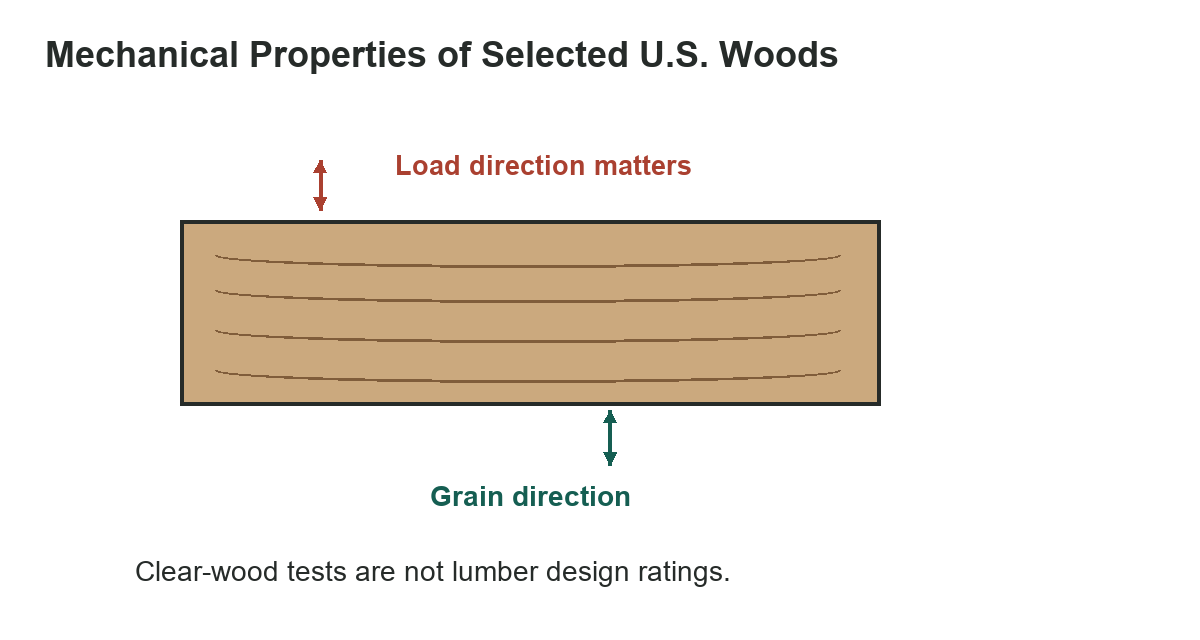
Strength terms also describe different failure modes. Bending resistance combines tension and compression across a member, whereas compression parallel to grain loads fibers along their length. A species can compare differently across these properties, so select the column that corresponds to the actual force path instead of treating the row as a single strength score.
Finished lumber can contain knots, slope of grain, checks, and other characteristics that change member strength. Structural design values are assigned to graded products under applicable rules. A clear-specimen result cannot replace a grade stamp, span table, building code, or qualified design.
Use the chart as a comparison aid
First match the property to the load: bending, compression parallel to grain, compression perpendicular to grain, shear, or another mode. Then confirm moisture condition and units. A larger number in one column does not make a species stronger for every use.
The values are a selected subset of a historical reference table. Current USDA Forest Products Laboratory material separates basic mechanical properties from design properties for graded lumber. Keep that distinction whenever a result could be used to size a structural member.
Even a nominally similar species name may represent different growing regions and material populations. The table keeps selected regional Douglas-fir entries separate for that reason. It is useful for understanding variation in test data, but not for choosing a beam without the required grade, dimensions, span, load, moisture condition, and design method.
These columns are reported in thousands of pounds per square inch, so multiply by 1,000 to express a value in psi. Preserve that conversion visibly in notes or calculations; confusing ksi and psi creates a thousand-fold error. More importantly, a test value describes the specimen and test method, not the safety factor or allowable capacity of a finished component.
If the question is structural, identify whether the member is sawn lumber, engineered wood, or another product and use the design values for that exact category. A licensed professional or approved span resource can account for load duration, support, bracing, connections, and other design factors that this species table does not cover.
- Identify load direction relative to the grain.
- Match the property name and moisture condition.
- Keep ksi distinct from psi; 1 ksi equals 1,000 psi.
- Do not apply clear-wood values directly to a structure.
- Use applicable grades, product specifications, and design standards.
Compare workbench-top wood choices, plan cuts with the table-saw guide, and browse the reference chart library.
References
The selected test results are from the USDA Forest Products Laboratory Wood Handbook, FPL-GTR-190, Table 5-3b. For current context, see the 2021 chapter on mechanical properties and the chapter on stress grades and design properties.