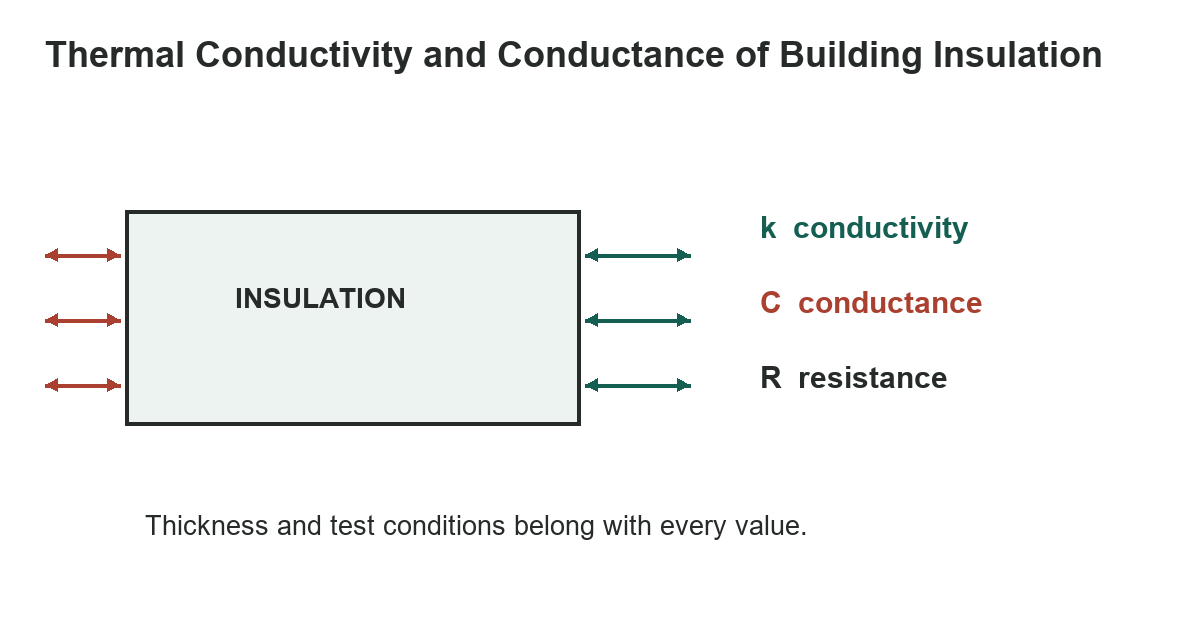
Thermal conductivity, conductance, and R-value all describe heat transfer, but they answer different questions. Conductivity describes a material property per unit thickness; conductance describes a specimen at a stated thickness; R-value describes resistance for the layer being compared. Read the property name, units, thickness, and test conditions together.
Conductivity and conductance
Conductivity is commonly written as k or lambda. Conductance is often written as C. For a uniform material under steady one-dimensional heat flow, conductance depends on both material and specimen thickness. Resistance is the reciprocal of conductance for the same specimen and unit system: R = 1/C. If conductivity and thickness are known, resistance can instead be estimated as R = thickness/k, with consistent units.
In U.S. customary units, conductivity may appear as Btu-in/(h ft2 F), while conductance appears as Btu/(h ft2 F). The inch in the conductivity unit matters. Do not take a reciprocal until the reported property and units are clear.
For a quick unit check, compare like with like: a conductivity value needs a thickness to describe a layer, while a conductance value already belongs to a specimen of stated thickness. Resistance uses the reciprocal relationship only when units are consistent. If a source mixes conventions, convert the units before comparing values rather than relying on the numeric size alone.
Keep a note of the source, date, and test conditions whenever you copy a value into a project estimate. That small record makes it easier to spot whether two numbers describe the same material form and temperature range. If those details are missing, treat the comparison as preliminary and locate the product’s current technical sheet before specifying it.
Selected historical insulation values
This chart reproduces selected mineral-fiber batt thickness and conductance entries from Table 1 of the USDA Forest Products Laboratory’s 1979 paper, which says the table was adapted from the 1977 ASHRAE Handbook. The source distinguishes conductivity from conductance; the rows shown here report conductance for the stated thickness ranges. These historical values are not current product specifications. The source lists conductance values to three decimals; the R values shown are their calculated reciprocals and remain approximate.
| Mineral-fiber batt | 2 to 2.75 | 0.143 | 6.99 |
|---|---|---|---|
| Mineral-fiber batt | 3 to 3.5 | 0.091 | 10.99 |
| Mineral-fiber batt | 6 to 7 | 0.045 | 22.22 |
| Mineral-fiber batt | 8.5 | 0.033 | 30.30 |
4 rows
Scroll horizontally to view all columns.
For the 3-to-3.5-inch entry, 1 / 0.091 is about R-10.99 for the listed specimen. That does not establish R-value per inch for every product in that thickness range.
The source conductance and calculated R figures are both rounded, so small differences can appear when the reciprocal is recomputed. Treat these results as an interpretation of the selected historical rows, not as a replacement for a product label or certification. A different batt, density, facing, or compression state may have a different measured resistance.
Compare labels and installed layers
Product labels usually state an R-value for a named product at a specified thickness. The U.S. Department of Energy explains that R-value depends on insulation type and thickness. Compare the marked value with the exact current product information instead of comparing unlike conductivity and conductance figures.
NIST’s insulation database records specimen source, designation, density, thickness, mean temperature, moisture, and thermal property. These details help explain why reported values can differ. ASTM C518 notes that measured properties can vary with composition, moisture, temperature, specimen thickness, and specimen history.
Choose the right value for the job
A material comparison does not calculate a whole wall or roof. Framing, gaps, compression, air leakage, moisture, thermal bridges, and installation affect the assembly. Use a current product rating and local building requirements for project decisions.
- Record whether the number is k, C, or R.
- Keep stated units and thickness beside it.
- Check mean test temperature and moisture when available.
- Use current tested information for a product comparison.
- Use an assembly-level method for whole-wall performance.
Browse the reference chart library, review the guide to garage-door insulation, and see how to install garage-door weather stripping when planning the rest of a garage envelope. For a building project, compare the whole assembly and address air leakage as well as insulation.
References
The historical values come from the USDA Forest Products Laboratory’s 1979 paper, Energy Efficiency in Light-Frame Wood Construction; its Table 1 credits the 1977 ASHRAE Handbook. For current material data and test context, see the NIST SRD 81 insulation database, ASTM C518, and Department of Energy insulation guidance.